6th Grade Unit 2: Human Impact on Earth's Climate Roadmap
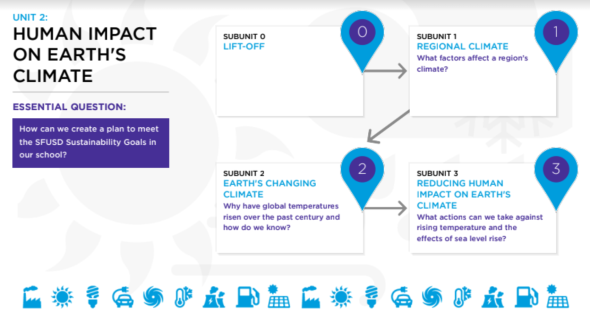
This page hosts Unit 2: Human Impact on Earth's Climate, and a roadmap of the 3 subunits that will be covered.
Subunit 1: Regional Climate
Link to this section
Below you will view and download:
🟧 Subunit Assessment Opportunities
🟧 5E Lesson Sequence
Subunit 1: Assessment Opportunities
Subunit 1 Assessment Opportunities
What should my students know and be able to do?
What should I prioritize?
Note: The materials below are personal recommendations from teachers in the field.
Feel free to consider your context when deciding whether to follow these suggestions.
|
|
|
|
|
|
|
|
|
|
|
|
|
|
|
|
|
|
|
|
|
|
|
|
|
|
|
|
|
|
Subunit 1: 5E Lesson Sequence
Subunit Description
📂 Download ALL lessons at one time for Unit 2: Subunit 1 from this folder. 📂
Throughout the course of this subunit, students construct a model to explain why different regions have particular climates. Using evidence from datasets, experiments, and articles, students construct and revise a model that explains how a region’s latitude, elevation, and proximity to large bodies of water contribute to a region’s climate.
The Big Conceptual Goals for this 5E cycle are
- Weather and climate are ways to describe atmospheric conditions at different time and geographic scales. Two indicators of a region’s weather and climate include its temperature and precipitation levels.
- As you move farther from the equator, the sunlight is spread out over a larger area due to the curvature of Earth. As a result, the temperature on average is lower in areas further from the equator than areas that are closer to the equator.
- Areas that are nearer to large bodies of water tend to be cooler in the summer and warmer in the winter and have a more narrow temperature range than areas that are farther away from large bodies of water. Areas that are located at high elevations also are cooler than regions that are closer to sea level.
| Lesson | Lesson Name | Teacher Document | Student Handout |
|---|---|---|---|
| 1 | Engage | ||
| 2 | Explore | ||
| 3 | Explain | ||
| 4 | Elaborate | 6.2 SU1 4Elaborate Student | |
| 5 | Evaluate | 6.2 SU1 5Evaluate Student | |
📂 Download ALL lessons at one time for Unit 2: Subunit 1 from this folder. 📂
Subunit 2: Earth's Changing Climate
Link to this section
Below you will view and download:
🟧 Subunit Assessment Opportunities
🟧 5E Lesson Sequence
Subunit 2: Assessment Opportunities
Subunit 2 Assessment Opportunties
What should my students know and be able to do?
What should I prioritize?
Note: The materials below are personal recommendations from teachers in the field.
Feel free to consider your context when deciding whether to follow these suggestions.
|
|
|
|
|
|
|
|
|
|
|
|
|
|
|
|
|
|
|
|
|
|
|
|
|
|
|
|
|
|
Subunit 2: 5E Lesson Sequence
Subunit Description
📂 Download ALL lessons at one time for Unit 2: Subunit 2 from this folder. 📂
Throughout the course of this subunit, students investigate why global temperatures on Earth are rising and the effect that this change has on sea level. Through discussions, experimentation, analysis of datasets, and informational texts students come to understand the cause and effect chain from increased fossil fuel use to sea level rise.
The Big Conceptual Goals for this 5E cycle are
- Carbon dioxide and other greenhouse gases have increased in Earth’s atmosphere since the Industrial Revolution.
- Greenhouse gases trap heat in Earth’s atmosphere, causing Earth surface temperatures to rise.
- A rise in global temperatures is causing sea levels to rise, which will affect the San Francisco Bay Area by causing flooding.
| Lesson | Lesson Name | Teacher Document | Student Handout |
|---|---|---|---|
| 1 | Engage | ||
| 2 | Explore | ||
| 3 | Explain | ||
| 4 | Elaborate | 6.2 SU2 4Elaborate Teacher | 6.2 SU2 4Elaborate Student |
| 5 | Evaluate | 6.2 SU2 5Evaluate Teacher | 6.2 SU2 5Evaluate Student |
📂 Download ALL lessons at one time for Unit 2: Subunit 2 from this folder. 📂
Subunit 3: Reducing Human Impact on Earth's Climate
Link to this section
Below you will view and download:
🟧 Subunit Assessment Opportunities
🟧 5E Lesson Sequence
Subunit 3: Assessment Opportunities
Subunit 3 Assessment Opportunities
What should my students know and be able to do?
What should I prioritize?
Note: The materials below are personal recommendations from teachers in the field.
Feel free to consider your context when deciding whether to follow these suggestions.
Subunit 3: 5E Lesson Sequence
Subunit Description
📂 Download ALL lessons at one time for Unit 2: Subunit 3 from this folder. 📂
This subunit is designed to help students analyze data and create explanations to complete the Culminating Project. Students begin by considering their own impact on Earth’s climate through a carbon footprint survey. Students then analyze San Francisco Unified School District (SFUSD) data about energy use and transportation and explain how the school contributes to rising global temperatures—one important aspect of climate change. Next, students consider different options for reducing the school’s carbon footprint through brainstorming and reading School Action Cards. Students then explore strategies San Francisco is using to manage sea level rise in vulnerable locations. In the Culminating Project, groups develop an action plan to meet SFUSD’s energy or transportation goals and reduce the school’s impact on rising global temperatures and sea level rise. Students write a letter describing their action plan and present their plans to the class using a cause and effect diagram to represent the plan. For the Individual Culminating Project, students provide feedback for a group’s plan. Finally, groups revise their plans based on feedback and send the letters to SFUSD and city officials.
The Big Conceptual Goals for this 5E cycle are
- Activities that we do regularly release varying amounts of carbon dioxide into the atmosphere.
- To reduce our impact on global temperature rise, we can reduce our activities that release carbon dioxide into the atmosphere.
- In addition to reducing carbon emissions, we can take steps to plan for and mitigate the effects of sea level rise in places like San Francisco.
| Lesson | Lesson Name | Teacher Document | Student Handout |
|---|---|---|---|
| 1 | Engage | ||
| 2 | Explore | ||
| 3 | Explain |
|
|
| 4 | Elaborate | 6.2 SU3 4Elaborate Student | |
| 5 | Evaluate | ||
📂 Download ALL lessons at one time for Unit 2: Subunit 3 from this folder. 📂
Unit 2: Human Impact on Earth's Climate Documents
Link to this section
Below you will view and download: Unit Plan, Standards, Culminating Project Assessments and Rubrics, Common Misconceptions, Materials, Unit 0: Lift-Off Lessons and Resources.
6.2 Human Impact on Earth's Climate: Overview
Overview
To create a plan that will help their school meet the sustainability goals of the San Francisco Unified School District (SFUSD), students will learn about the impact humans have on Earth’s climate, specifically increasing global surface temperatures. Students will learn about three of the factors that determine a region’s climate, latitude, elevation, and proximity to a large body of water, as well as how climate is different from weather. Students will learn that burning fuel releases carbon dioxide into the atmosphere and that increased carbon dioxide in the atmosphere creates an enhanced greenhouse effect that increases global surface temperatures. Next, students will investigate the effect that changes to Earth’s surface temperature has on sea level and consider how this issue might affect San Francisco, a coastal city. Finally, students will consider changes their school could make to reduce carbon emissions that would reduce its impact on Earth’s climate. Students will work collaboratively to create a plan that will be submitted to the SFUSD Office of Sustainability or the San Francisco Department of the Environment.
6.2 Human Impact on Earth's Climate: Unit Plan
Unit 2: Human Impact on Earth's Climate - Unit Plan
|
|
||
|
|
||
|
[Clarification Statement: Examples of the design process include examining human environmental impacts, assessing the kinds of solutions that are feasible, and designing and evaluating solutions that could reduce that impact. Examples of human impacts can include water usage (such as the withdrawal of water from streams and aquifers or the construction of dams and levees), land usage (such as urban development, agriculture, or the removal of wetlands), and pollution (such as of the air, water, or land).]
|
|
|
|
|
||
|
|
||
|
|
||
|
|
||
|
|
||
|
|
||
|
|
||
|
|
||
|
|
||
|
|
|
|
|
|
||||
|
|
|
|
|
|
|
|
|
|||
|
|
|
|
|
|
|
|
|
|
||
|
|
|
|
|
|
|
|
|
|||
|
|
|
|||
|
|
|
|||
|
|
||||
|
|
|
|
|
|
|
|
|
|
||
|
|
|
|
|
|
|
|
|
|
|
|
|
|
|
|
||
|
|
||||
|
|
|
|
|
|
|
|
|
|
|
|
|
|
|
|
|
|
“Disciplinary Core Ideas, Science and Engineering Practices, and Crosscutting Concepts” are reproduced verbatim from A Framework for K-12 Science Education: Practices, Crosscutting Concepts, and Core Ideas. DOI: https://doi.org/10.17226/13165. National Research Council; Division of Behavioral and Social Sciences and Education; Board on Science Education; Committee on a Conceptual Framework for New K-12 Science Education Standards. National Academies Press, Washington, DC. This material may be reproduced for noncommercial purposes and used by other parties with this attribution. If the original material is altered in any way, the attribution must state that the material is adapted from the original. All other rights reserved.
6.2 Human Impact on Earth's Climate: Standards
Human Impact on Earth’s Climate
Next Generation Science Standards Performance Expectations
|
|
atmospheric and oceanic circulation that determine regional climates. [Clarification Statement: Emphasis is on how patterns vary by latitude, altitude, and geographic land distribution. Emphasis of atmospheric circulation is on the sunlight-driven latitudinal banding, the Coriolis effect, and resulting prevailing winds; emphasis of ocean circulation is on the transfer of heat by the global ocean convection cycle, which is constrained by the Coriolis effect and the outlines of continents. Examples of models can be diagrams, maps and globes, or digital representations.] [Assessment Boundary: Assessment does not include the dynamics of the Coriolis effect.] |
|
|
[Clarification Statement: Examples of factors include human activities (such as fossil fuel combustion, cement production, and agricultural activity) and natural processes (such as changes in incoming solar radiation or volcanic activity). Examples of evidence can include tables, graphs, and maps of global and regional temperatures, atmospheric levels of gases such as carbon dioxide and methane, and the rates of human activities. Emphasis is on the major role that human activities play in causing the rise in global temperatures.] |
|
|
[Clarification Statement: Examples of the design process include examining human environmental impacts, assessing the kinds of solutions that are feasible, and designing and evaluating solutions that could reduce that impact. Examples of human impacts can include water usage (such as the withdrawal of water from streams and aquifers or the construction of dams and levees), land usage (such as urban development, agriculture, or the removal of wetlands), and pollution (such as of the air, water, or land).] |
NGSS Lead States. 2013. Next Generation Science Standards: For States, By States. Washington, DC: The National Academies Press.
Disciplinary Core Ideas
ESS2.D: Weather and Climate
ESS3.D: Global Climate Change
- Human activities, such as the release of greenhouse gases from burning fossil fuels, are major factors in the current rise in Earth’s mean surface temperature (global warming). Reducing the level of climate change and reducing human vulnerability to whatever climate changes do occur depend on the understanding of climate science, engineering capabilities, and other kinds of knowledge, such as understanding of human behavior and on applying that knowledge wisely in decisions and activities.(MS-ESS3-5)
ESS3.C: Human Impacts on Earth Systems
- Human activities have significantly altered the biosphere, sometimes damaging or destroying natural habitats and causing the extinction of other species. But changes to Earth’s environments can have different impacts (negative and positive) for different living things. (MS-ESS3-3)
- Typically as human populations and per-capita consumption of natural resources increase, so do the negative impacts on Earth unless the activities and technologies involved are engineered otherwise. (MS-ESS3-3)
Science and Engineering Practices
Developing and Using Models
Modeling in 6–8 builds on K–5 experiences and progresses to developing, using, and revising models to describe, test, and predict more abstract phenomena and design systems.
- Develop and use a model to describe phenomena. (MS-ESS2-6)
Asking Questions and Defining Problems
Asking questions and defining problems in grades 6–8 builds on K–5 experiences and progresses to specifying relationships between variables, and clarifying arguments and models.
- Ask questions to identify and clarify evidence of an argument. (MS-ESS3-5)
Constructing Explanations and Designing Solutions
Constructing explanations and designing solutions in 6–8 builds on K–5 experiences and progresses to include constructing explanations and designing solutions supported by multiple sources of evidence consistent with scientific ideas, principles, and theories.
- Construct a scientific explanation based on valid and reliable evidence obtained from sources (including the students’ own experiments) and the assumption that theories and laws that describe the natural world operate today as they did in the past and will continue to do so in the future.
- Construct an explanation using models or representations.
- Apply scientific principles to design an object, tool, process or system. (MS-ESS3-3)
Planning and Carrying Out Investigations
Planning and carrying out investigations to answer questions or test solutions to problems in 6–8 builds on K–5 experiences and progresses to include investigations that use multiple variables and provide evidence to support explanations or design solutions.
- Collect data to produce data to serve as the basis for evidence to answer scientific questions or test design solutions under a range of conditions.
*Analyzing and Interpreting data (Focal Practice)
Analyzing data in 6–8 builds on K–5 experiences and progresses to extending quantitative analysis to investigations, distinguishing between correlation and causation, and basic statistical techniques of data and error analysis.
- Apply concepts of statistics and probability (including mean, median, mode, and variability) to analyze and characterize data, using digital tools when feasible.
- Use graphical displays (e.g., maps, charts, graphs, and/or tables) of large data sets to identify temporal and spatial relationships.
Obtaining, Evaluating, and Communicating Information
Obtaining, evaluating, and communicating information in 6–8 builds on K–5 experiences and progresses to evaluating the merit and validity of ideas and methods.
- Critically read scientific texts adapted for classroom use to determine the central ideas and/or obtain scientific and/or technical information to describe patterns in and/or evidence about the natural and designed world(s).
- Communicate scientific and/or technical information (e.g. about a proposed object, tool, process, system) in writing and/or through oral presentations.
Crosscutting Concepts
*Cause and Effect (Focal Crosscutting Concept)
Events have causes, sometimes simple, sometimes multifaceted. A major activity of science is investigating and explaining causal relationships and the mechanisms by which they are mediated. Such mechanisms can then be tested across given contexts and used to predict and explain events in new contexts.
- Relationships can be classified as causal or correlational, and correlation does not necessarily imply causation. (MS-ESS3-3)
- Cause and effect relationships may be used to predict phenomena in natural or designed systems.
Systems and System Models
-
Models can be used to represent systems and their interactions—such as inputs, processes and outputs—and energy, matter, and information flows within systems. (MS-ESS2-6)
Stability and Change
-
Stability might be disturbed either by sudden events or gradual changes that accumulate over time. (MS-ESS3-5)
-
Explanations of stability and change in natural or designed systems can be constructed by examining the changes over time and processes at different scales, including the atomic scale.
“Disciplinary Core Ideas, Science and Engineering Practices, and Crosscutting Concepts” are reproduced verbatim from A Framework for K-12 Science Education: Practices, Crosscutting Concepts, and Core Ideas. DOI: https://doi.org/10.17226/13165. National Research Council; Division of Behavioral and Social Sciences and Education; Board on Science Education; Committee on a Conceptual Framework for New K-12 Science Education Standards. National Academies Press, Washington, DC. This material may be reproduced for noncommercial purposes and used by other parties with this attribution. If the original material is altered in any way, the attribution must state that the material is adapted from the original. All other rights reserved.
Connections to Nature of Science
ETS2B: Influence of Science, Engineering, and Technology on Society and the Natural World
- The uses of technologies and any limitations on their use are driven by individual or societal needs, desires, and values; by the findings of scientific research; and by differences in such factors as climate, natural resources, and economic conditions. Thus technology use varies from region to region and over time. (MS-ESS3-3)
NGSS Lead States. 2013. Next Generation Science Standards: For States, By States. Washington, DC: The National Academies Press.
Link to Connect the 6th Grade Human Impact on Earth’s Climate Unit with Prior Knowledge.
6.2 Human Impact on Earth's Climate: Culminating Project Assessments and Rubrics
Culminations Project Assessments and Rubrics
📂Download ALL files at one time from the 6.2 Culminating Project Assessments folder.📂
| Culminating Project File Docs |
|---|
| 6.2 Main–Culminating Projects |
| 6.2 Oral Presentation Rubric |
| 6.2 Science Content Rubric |
| 6.2 Science and Engineering Practices Rubric |
📂Download ALL files at one time from the 6.2 Culminating Project Assessments folder.📂
6.2 Human Impact on Earth's Climate: Common Misconceptions
Common Misconceptions
View and download (by making a copy) 6.2 Common Misconceptions
Lift-Off
|
|
|
|
|
|
Subunit 1: Region’s Climate
What factors affect a region’s climate?
|
|
|
|
|
|
|
|
|
Subunit 2: Earth’s Changing Climate
Why have global temperatures risen over the past century and how do we know?
|
|
|
|
|
|
|
|
|
|
|
|
|
|
|
Subunit 3: Reducing Human Impact on Earth’s Climate
What actions can we take against rising temperature and the effects of sea level rise?
|
|
|
|
https://19january2017snapshot.epa.gov/climatechange_.html) |
program, a voluntary initiative that drives more widespread use of energy-efficient products and practices, has saved U.S. businesses, organizations, and consumers more than $362 billion in energy costs since 1992 while avoiding more than 2 billion metric tons of greenhouse gas emissions. (https://19january2017snapshot.epa.gov/climatechange_.html) |
|
(https://19january2017snapshot.epa.gov/climatechange_.html) |
label on appliances and other products, recycling and composting, purchasing green power, using public transit, and bicycling or walking instead of driving can make a difference by reducing your household’s carbon footprint. (https://19january2017snapshot.epa.gov/climatechange_.html) |
View and download (by making a copy) 6.2 Common Misconceptions
6.2 Human Impact on Earth's Climate: Materials
Materials
The Unit 2: Human Impact on Earth’s Climate Materials table includes all of the items needed to teach five sections of this unit in a classroom of 32 students (eight groups of four). A detailed breakdown of how these items are used throughout the unit can be found in your Teacher Background Section at the subunit level and in each individual lesson in your Teacher Guide.
- Permanent materials have already been provided to all middle schools in the district and are expected to be reused from year to year.
- Consumable materials are replenished on an as-needed basis from year to year.
- Teacher Provided materials must be supplied by teachers each year.
Unit 2: Human Impact on Earth’s Climate Materials
6.2 Human Impact on Earth's Climate: Subunit 0: Lift-Off Lessons
Subunit 0: Lift-Off
📂 Download ALL lessons at one time for Subunit 0: Lift-Off from this folder.📂
Lessons
| Lift-Off Lesson Documents |
|---|
| 6.2 SU0 Liftoff Slides |
| 6.2 SU0 Liftoff Teacher |
| 6.2 SU0 Liftoff Student |
📂 Download ALL lessons at one time for Subunit 0: Lift-Off from this folder.📂
6.2 Human Impact on Earth's Climate: Want to know more about this unit?
Want to know more about this unit?
Resources
Here are some resources for Unit 6.2 Human Impact on Earth’s Climate:
National Science Teacher Association: Climate Science Resources
National Science Teachers Association - NSTA. “Books & Resources.” NSTA. Accessed October 25, 2019. https://www.nsta.org/climate/.
U.S. Environmental Protection Agency: Global Climate Change
EPA. Environmental Protection Agency. Accessed October 25, 2019. https://www.epa.gov/sites/production/files/signpost/cc.html.
National Oceanic and Atmospheric Administration: Climate Education Resources “Climate Education Resources.” Climate education resources | National Oceanic and Atmospheric Administration. Accessed October 25, 2019. https://www.noaa.gov/education/resource-collections/climate-education-resources.
NASA Global Climate Change: Vital Signs of the Planet “For Educators.” NASA. NASA, January 3, 2018. https://climate.nasa.gov/resources/education/.
Exploratorium: Global Climate Change Explorer
“Global Climate Change Explorer.” Exploratorium, May 3, 2019. https://www.exploratorium.edu/climate.
California Academy of Sciences: Climate Change
“Climate Change.” California Academy of Sciences. Accessed October 25, 2019. https://www.calacademy.org/blogs/landing/climate-change.
American Museum of Natural History: Climate Change
“Climate Change Exhibition: AMNH.” American Museum of Natural History. Accessed October 25, 2019. https://www.amnh.org/exhibitions/climate-change.
San Francisco Sea Level Rise Action Plan
Accessed October (not set), 2019. https://default.sfplanning.org/plans-and-programs/planning-for-the-city/sea-level-rise/160309_SLRAP_Final_ED.pdf.
Cornell University Press: Communicating Climate Change
Armstrong, Anne K., Marianne E. Krasny, Cornell University, and Cornell University. “Communicating Climate Change.” Cornell Open. Accessed October 25, 2019. https://cornellopen.org/9781501730795/communicating-climate-change/.
American Geophysical Union: Climate Change Is About to Show Up On Your Local Weather Report
Other Resources in 6.2 Human Impact on Earth’s Climate
Agency, U.S. Environmental Protection. YouTube. YouTube, April 3, 2015. https://www.youtube.com/watch?v=VYMjSule0Bw.
Department of the Environment and Energy. Accessed October 30, 2019. https://www.environment.gov.au/climate-change/climate-science-data/climate-science/greenhouse-effect.
Desonie, Dana. “Ocean Currents and Climate.” CK. CK-12 Foundation, May 23, 2018. https://www.ck12.org/earth-science/ocean-currents-and-climate/lesson/How-Ocean-Currents-Moderate-Climate-HS-ES/?referrer=concept_details.
Dunbar, Brian. “What's the Difference Between Weather and Climate?” NASA. NASA, March 9, 2015. https://www.nasa.gov/mission_pages/noaa-n/climate/climate_weather.html.
Earth. Accessed October 30, 2019. http://earththeoperatorsmanual.com/segment/5.
“Extreme Events.” National Climatic Data Center. Accessed October 25, 2019. https://www.ncdc.noaa.gov/climate-information/extreme-events.
Farahmand, Ben. “Tuva on the IPad.” Tuva. Accessed February 13, 2020. https://support.tuvalabs.com/hc/en-us/articles/360007375954.
GLBioenergy. YouTube. YouTube, August 7, 2015.
https://www.youtube.com/watch?v=o9XSE_7xn8I.
KQED. “KQED Public Media for Northern CA.” KQED, July 17, 2012. https://www.kqed.org/news/70533/why-its-chilly-in-san-francisco.
“Learn the Basics.” EPA. Environmental Protection Agency. Accessed October 30, 2019. https://archive.epa.gov/climatechange/kids/basics/index.html.
“Look Ahead San Francisco VR App.” TACTIC. Accessed October 25, 2019. https://tactic.studio/look-ahead-sf-vr-app
“Microclimates in Fogtown.” Exploratorium, September 4, 2018. https://www.exploratorium.edu/video/microclimates-fogtown.
NASA. Accessed October 30, 2019. https://climatekids.nasa.gov/greenhouse-cards/.
“Sfenvironment.org - Our Home. Our City. Our Planet.” sfenvironment.org - Our Home. Our City. Our Planet. Accessed October 30, 2019. https://sfenvironment.org/.
“News.” National Climatic Data Center. Accessed October 25, 2019. https://www.ncdc.noaa.gov/news/climate-change-and-extreme-snow-us).
“NOAA Logo Sea Level Rise Viewer.” View site. Accessed October 25, 2019. https://coast.noaa.gov/slr/#/layer/slr/0/-11581024.663779823/5095888.569004184/4/satellite/none/0.8/2050/interHigh/midAccretion.
NOAA Tides & Currents. Accessed October 25, 2019. https://tidesandcurrents.noaa.gov/datum_options.html.
“Resources.” Project Green Schools. Accessed October 25, 2019. https://projectgreenschools.org/resources/.
“The Effects of Climate Change.” NASA. NASA, September 30, 2019. https://climate.nasa.gov/effects/.
The Washington Post. WP Company. Accessed October 30, 2019. https://www.washingtonpost.com/graphics/national/power-plants/?utm_term=.09611abd7e91.
“Sea Level Rise Vulnerability & Consequences Assessment.” Sea Level Rise Vulnerability & Consequences Assessment | SF Planning. Accessed October 25, 2019. https://sfplanning.org/sea-level-rise-action-plan.
Tam, Laura, and Bay Conservation and Development Commission. “Strategies for Managing Sea Level Rise.” SPUR, March 9, 2016. https://www.spur.org/publications/urbanist-article/2009-11-01/strategies-managing-sea-level-rise.
“Tutorial for Sea Level Rise Viewer: Local Scenarios.” Accessed October (not set), 2019. https://coast.noaa.gov/digitalcoast/training/slr-tutorial.html.
US Department of Commerce, and National Oceanic and Atmospheric Administration. “Is Sea Level Rising?” NOAA's National Ocean Service, October 27, 2008. https://oceanservice.noaa.gov/facts/sealevel.html#target
“U.S. Energy Information Administration - EIA - Independent Statistics and Analysis.” How much of U.S. carbon dioxide emissions are associated with electricity generation? - FAQ - U.S. Energy Information Administration (EIA). Accessed October 30, 2019.
https://www.eia.gov/tools/faqs/faq.php?id=77&t=3.
“What Causes the Seasons?” NASA. NASA, September 30, 2019.
https://spaceplace.nasa.gov/seasons/en/.
“What Can We Do to Help?” NASA. NASA. Accessed October 25, 2019. https://climatekids.nasa.gov/how-to-help/.
“What Is Happening in the Ocean?” NASA. NASA. Accessed October 25, 2019. https://climatekids.nasa.gov/ocean/.
Young Voices for the Planet Film and Video Series. Accessed October 30, 2019. https://www.youngvoicesfortheplanet.com/youth-climate-videos/dreaming-in-green/.
View and download (by making a copy) of Resources
Note: The CC BY-NC 4.0 License does not apply to photos, images, articles, and other materials within the curriculum that have been licensed by San Francisco Unified School District and Stanford University (the Authors). These include but are not limited to photos from commercial stock photo/image agencies such as Shutterstock.com or Getty Images (iStock.com) and photos or graphics where the Authors obtained permission from organizations such as UCMP or SERP. This CC BY-NC 4.0 License also does not apply to articles that the Authors received permission to reprint [Reprinted with Permission]. You can identify such a photo, image, or licensed material by looking at the credit embedded within or associated with the content. You are allowed to reproduce the licensed material for your own personal, classroom, non-commercial use only, BUT (i) you may not modify, alter, adapt, or otherwise create any derivative work from, a licensed material and (ii) you may not distribute, transmit or disseminate a licensed material or any copy or derivative work thereof, to any third party, whether by itself, as part of a large works, or otherwise.
Note also, that throughout the student pages, there are some icons created by SFUSD and Stanford that may not have a credit line because of lack of space.
The general icons that follow were created by the San Francisco Unified School District and Stanford University and are all [CC BY-NC 4.0]:

The culminating project icons that follow were created or photographed by the San Francisco Unified School District and Stanford University and are all [CC BY-NC 4.0]:

6th Grade Science Units Link to this section

This page was last updated on July 24, 2023