SFUSD’s Graduation Rate Rises to 87.3% Link to this section
District Rate Surpasses California, Shows Steady Growth Over Past 4 Years
San Francisco (December 14, 2020) – The California Department of Education (CDE) has released its 2019-20 Cohort Outcome Data, which includes graduation rates. San Francisco Unified School District (SFUSD) cohort graduation rate improved from 84.4% in 2016-17 to 87.3% in 2019-20. According to the CDE, it has made several changes to the calculation of the cohort graduation rate in response to federal requirements, which means the 2016-17 numbers should be viewed as a new baseline year.
“As a school district we use many measures for how well we are preparing our students for college, careers and life, and graduation rates are one of those important data points,” Superintendent Dr. Vincent Matthews said. “Even though we had to make a shift to remote teaching and learning for the second half of their final semester when the pandemic began, the hard work of the class of 2020 as well as teachers and families have contributed to our steady positive upward trend of our rising graduation rate.”
Over the past decade, SFUSD has developed and implemented systems to better identify and track the progress of students towards graduation including the development of on-track off-track measures for early intervention. SFUSD has also implemented a portfolio of credit-earning options for students so if a student needs to make up a course, they can do so without falling further behind.
SFUSD high schools have also expanded programs that give students real-world career learning experiences, which research shows increases student engagement, a precursor for persisting through high school.
The graduation rate overall and for most subgroups is higher than the state and has increased from last year*. To view detailed results, visit the state’s website or see table 1 below.
Overall, SFUSD’s graduation rate surpassed the state’s rate this year (the state’s graduation rate is 84.3% compared to SFUSD’s graduation rate of 87.3%) and the district saw an increase in its rate as compared to the previous year while the state’s rate decreased. The majority of SFUSD’s subgroups also maintained higher graduation rates as compared to the state’s rate for that subgroup.
As compared to the previous year, subgroups of students that saw greater increases than the district include Filipino students (91% in 2018-19 to 94.4% in 2019-20), Latino students (74.8% to 76.0%), Pacific Islander students (78% to 82.9%), White students (86.9% to 90.0%), and Multi Racial students (81.3% to 89.1%).
In addition, for program subgroups, the graduation rate increased from last year to this year for English Learners, Foster Youth, Students with Disabilities and Socioeconomically Disadvantaged Youth. Foster youth as a whole showed a larger increase than the district average (68.8% to 77.3%).
As compared to last year, there was a decrease in the graduation rate for African American (AA) students in the state and SFUSD. The District’s current graduation rate is much higher than the average rate of AA students at the state level and the four-year trend for African American students is overall positive (76.8% in 2016-17 to 80.6% in 2019-20).
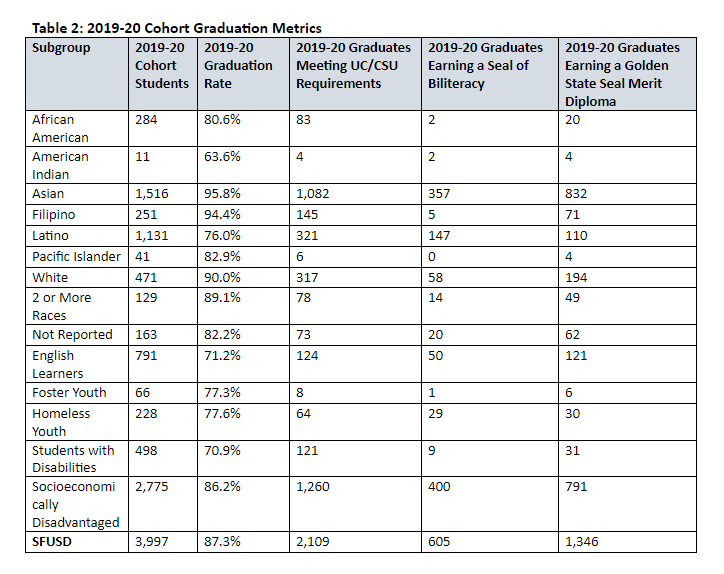
CDE also reports data on other metrics for this cohort of recent graduates (see Table 2).
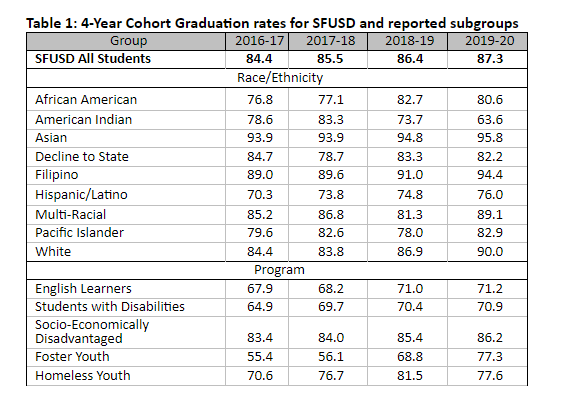
*Last year, SFUSD reported its graduation rate based on the CA Dashboard. This year, as in previous years, SFUSD is reporting its graduation rate based on DataQuest because the Dashboard data is not available this year. The 2018-19 graduation rate based on DataQuest was 86.4%.
##
This page was last updated on December 14, 2020