Introduction
This dashboard reports on our progress in fixing our EMPowerSF payroll system. The system is “fixed” when our employees do not have on-going payroll issues. Progress is defined by minimizing the impact of our employees until the system is fixed. The district has identified Key Performance Indicators (KPIs) to track our progress.
Our first two KPI reports are about closing payroll tickets and reducing the number of impacted employees. In the coming weeks, we will establish benchmarks to assess our effort toward fixing our system.
This dashboard will evolve as we continue to gather data on our progress and identify additional KPIs. Most importantly, will be establishing a timeline for fully fixing EMPowerSF once we have more data on what it takes to resolve issues
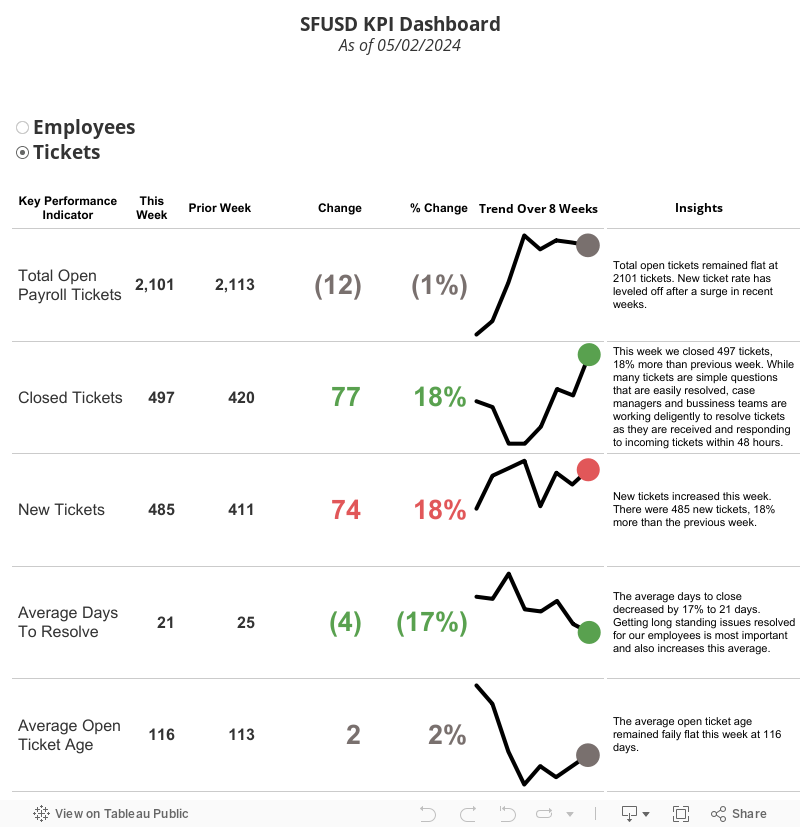
SFUSD KPI Dashboard
Note: If you have issues accessing the data in the chart, please email newsline@sfusd.edu.
Key Terms
- Total Impacted Employees – The total number of unique employees that have open payroll tickets
- Resolved Employees – The number of employees that had all their payroll related tickets resolved this week
- New Impacted Employees – Employees that have payroll related tickets this week but did not have payroll related tickets in the prior week
- Average Days to Resolve – The average of the number of days that each impacted employee had to wait for resolution of their payroll related tickets
- Average Impacted Days – The average number of days current impacted employees have been waiting for payroll tickets to be resolved
- Total Open Payroll Tickets – The total number of payroll related tickets that are currently open
- Closed Tickets – The total number of payroll related tickets closed this week
- New Tickets – The total number of new payroll related tickets created this week
- Average Days to Resolve – For the tickets closed this week, the KPI represents the average number of days each ticket was open
- Backlog Age – The average number of days open payroll related tickets have been waiting to be resolved
November 23, 2022 Insights
November 23, 2022 Insights – Employees Impacted
Due to the short holiday week, we see an overall decrease in the number of total impacted employees, resolved employees and new impacted.
Total Impacted Employees – The number of employees with open tickets as of 11/23 is 4,661, a decrease of 14 from the prior week. The decline is driven by the resolution of tickets outpacing the number of new employees impacted by payroll issues
Resolved Employees – The number of employees whose tickets were resolved this week was 68, a decrease 30 from the prior week. The unfavorable trend is driven by the short holiday week.
New Impacted Employees – The number of employees submitting new tickets was 54, a decline of 71 from the prior week. The favorable trend this week is likely driven by the holiday week.
Average Days to Resolve – The average days it took to resolve the tickets closed this week was 70, a slight increase, 1, from the prior week and a significant increase from 24 reported two weeks ago. The increase compared to two weeks ago is due to the case management team focusing efforts on closing old tickets that have been outstanding for extended periods of time.
Average Impacted Days – The average days that an employee’s tickets are currently outstanding is 148, an increase of 6 from the prior week. This has been relatively unchanged over the past four weeks.
November 23, 2022 Insights – Open Tickets
Due to the short holiday week, we see an overall decrease in the number of total impacted employees, resolved employees and new impacted.
Total Open Payroll Tickets – The number of open tickets as of 11/23 is 10,104, a decrease of 79 from the prior week. The favorable trend is driven by the resolution of tickets outpacing the number of new tickets.
Closed Tickets – The number of employees whose tickets were resolved this week was 267, a decrease 112 from the prior week. The unfavorable trend is driven by the short holiday week.
New Tickets – The number new tickets submitted this week was 188, a decline of 247 from the prior week. The significant decline this week in newly impacted employees is likely driven by the holiday week.
Average Days to Resolve – The average days it took to resolve the tickets closed this week was 62, a slight improvement from the prior week and a significant increase from two weeks ago. The increase compared to two weeks ago is due to the case management team focusing efforts on closing old tickets that have been outstanding for extended periods of time.
Average Ticket Age – The average days that an employee’s tickets are currently outstanding is 102, an increase of 6 from the prior week. The age of the tickets continues to grow as the backlog continues to increase.
This page was last updated on December 5, 2022