Press Release Details
SFUSD’s Graduation Rate Rises to 88.3%, with Greatest Increases for African American, Special Education Students Link to this section
San Francisco (January 10, 2022) – The California Department of Education (CDE) has released its 2020-21 Four-Year Cohort Reports, which include graduation rates. San Francisco Unified School District (SFUSD) cohort graduation rate improved from 84.4% in 2016-17 to 88.3% in 2020-21. The graduation rate in 2016-17 is used as a baseline for comparison due to federal requirements that prompted changes to the calculation of the cohort graduation rate.
“We use many measures for how well we are preparing our students for college, careers and life, and graduation rates are one of those important data points,” SFUSD Superintendent Dr. Vincent Matthews said. “Even in the face of a one-in-a-century pandemic, the hard work of the class of 2021 as well as teachers and families have contributed to a steady positive upward trend of our rising graduation rate. In SFUSD we have put a lot of systems in place to support students as they progress toward graduation.”
“Our graduation rates reflect our growth toward more equitable outcomes for students who have been historically underserved by our public schools,” said SF Board of Education President Gabriela Lopez. “These results are cause for celebration even while we keep our focus on all that still needs to be done.”
Over the past decade, SFUSD has developed and implemented systems to better identify and track the progress of students towards graduation including the development of on-track off-track measures for early intervention. SFUSD has also implemented a portfolio of credit-earning options for students so if a student needs to make up a course, they can do so without falling further behind.
SFUSD high schools have also expanded programs that give students real-world career learning experiences, which research shows increases student engagement, a precursor for persisting through high school. In addition, the district has developed evidence-based programs to strategically support English Learners and African American students. During the pandemic SFUSD continued these supports even while students were learning remotely for a year.
5-YEAR GRADUATION TRENDS FOR SFUSD
The graduation rates overall and for all reportable subgroups (listed below) have increased steadily since the 2016-17 school year. To view detailed overall and subgroup results over the last five years, see Table 1 below.
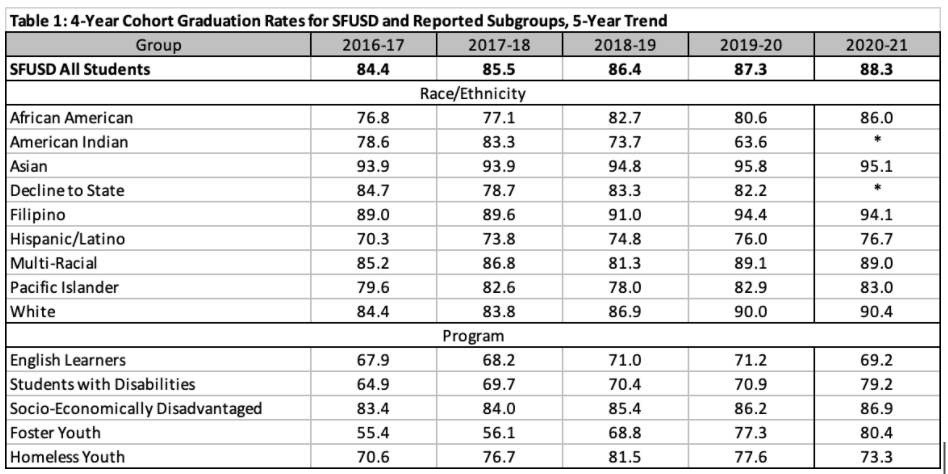
As compared to the previous year, subgroups of students that saw greater increases than the district include African American students (80.6% in 2019-20 to 86% in 2020-21), Students with Disabilities (70.9% in 2019-20 to 79.2% in 2020-21) and Foster Youth (77.3% in 2019-20 to 80.4% in 2020-21). Three high schools (Burton, Lincoln and Wallenberg) had a graduation rate of 95% or above for African American students. Five high schools (Ruth Asawa, Lincoln, Lowell, Wallenberg, and Washington) had a graduation rate of 87.5% or above for Students with Disabilities.
COMPARISON BETWEEN SFUSD AND STATE GRADUATION RATES
Overall, SFUSD’s graduation rate once again surpassed the state’s rate (the state’s graduation rate is 83.6% compared to SFUSD’s 88.3%). The district saw an increase in its rate as compared to the previous year, while the state’s rate decreased for the second year in a row. All of SFUSD’s reportable subgroups graduated at higher rates than the same subgroup at the state level, except for Latino students. However, the gap between the state’s graduation rate for Latino students and SFUSD has decreased steadily since 2016-17 -- when the difference was 13.7 percentage points -- to 2020-21, when the gap shrank to 3.7 percentage points.
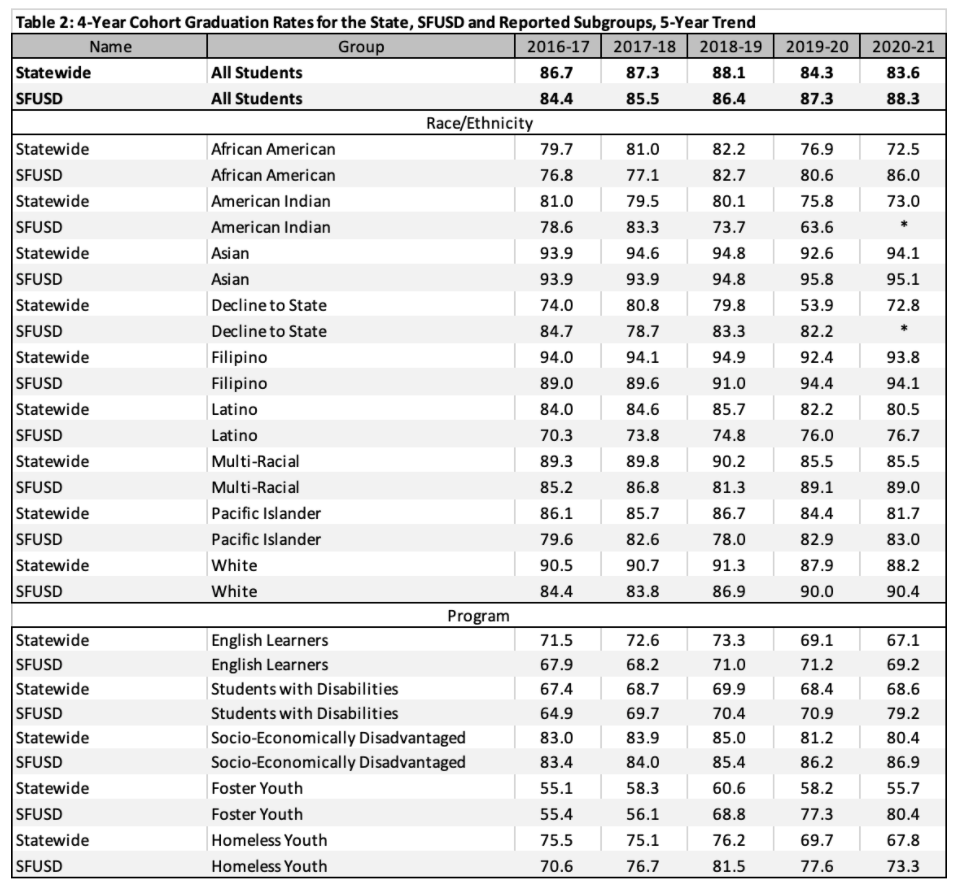
As compared to last year, there was a decrease in the graduation rate for African American students in the state while the rate increased for African American students in SFUSD. The District’s 2020-21 graduation rate is much higher than the average rate of AA students at the state level and the five-year trend for African American students is overall positive (76.8% in 2016-17 to 86% in 2020-21).
SFUSD GRADUATE METRICS
CDE also reports data on other metrics for this cohort of recent graduates (see Table 3). In addition to the graduation rate, the additional metrics reported include graduates meeting UC/CSU requirements, graduates earning a seal of biliteracy and graduates earning a Golden State Seal Merit Diploma. On all these metrics SFUSD has significantly improved its rates as compared to the previous year (see Table 3).
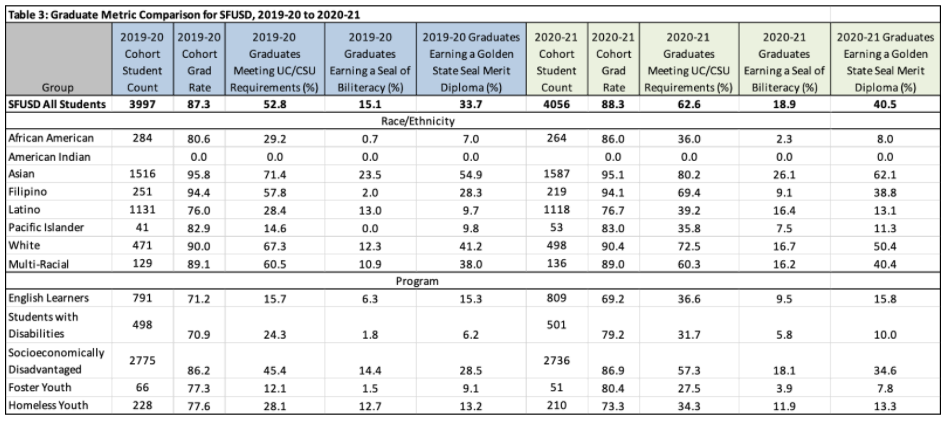
Source: California Department of Education, DataQuest (https://dq.cde.ca.gov/dataquest/). Date: Data current as of 12/20/2021. Definitions: To protect student privacy, data are suppressed (*) if the cell size within a selected student population (cohort students) is 10 or fewer. Additionally, the race/ethnicity group “decline to state” is suppressed regardless of actual cell size if the student population for one or more other groups is suppressed. For metrics listed in Table 3, the denominator in each case is the Cohort Student count.
###